


Quick answer
Baymard found that 52% of benchmarked desktop sites showed cart or added-to-cart recommendations that were irrelevant or based solely on what other customers bought. In a separate checkout test, 66% of users who encountered a standalone Amazon cross-sell step showed extreme frustration. That second figure measures observed frustration at one checkout step, rather than abandonment or a sitewide conversion rate.
Baymard Institute: Cross-sell relevance in the cart · Baymard Institute: Checkout cross-sell examples
Key findings and sources
Irrelevant cart cross-sells
Baymard found that 52% of its benchmarked desktop websites showed irrelevant or other-customer-only cross-sells in the cart or added-to-cart confirmation.
Baymard Institute: Cross-sell relevance in the cart
Baymard desktop site benchmark; published article does not provide a sample count for this rate. Exact benchmark percentage with the two qualifying categories combined by the source.
Forced upsell-step frustration
In Baymard usability testing, 66% of users who encountered a separate Amazon cross-sell step after starting checkout showed extreme frustration.
Baymard Institute: Checkout cross-sell examples
Amazon test scenario; this measures an observed reaction among exposed users. Exact share reported in the test description, with no conversion inference.
Missing title and price comparison
In Baymard’s separate desktop product-page cross-sell benchmark, 55% lacked fully visible titles and 15% lacked prices, a 40 percentage point difference.
Baymard Institute: Product-page cross-sell information
Desktop product-page recommendations; neither number is a cart-offer rate. Compare published percentages for title and price availability in the same benchmark.
Mobile and app visual examples
Mobile or app screens accounted for about 47.4% of Baymard’s 390 public cross-sell screenshot examples at readback.
Baymard Institute: Checkout cross-sell examples
Public screenshot records, not independent shops or shopper sessions. Add 138 mobile and 47 app records, then divide by the 390 displayed records.
Compare the results
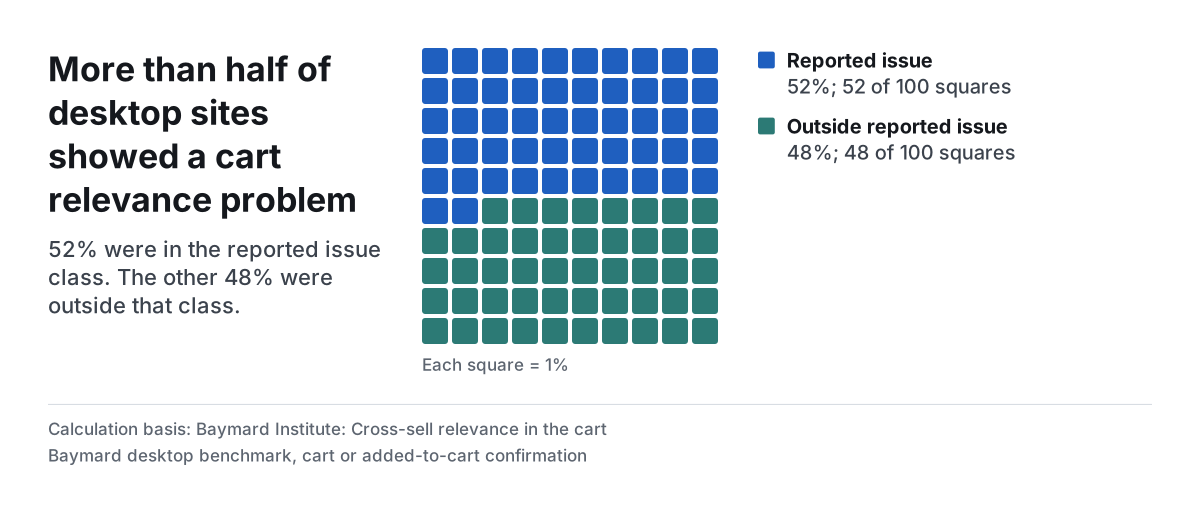
More than half of desktop sites showed a cart relevance problem
52% were in the reported issue class. The other 48% were outside that class.
An upsell can ask too much at the wrong time
A customer who adds a coffee machine may appreciate knowing which filters fit. The same customer should not have to turn down a general store promotion before they can reach payment. Put compatible accessories near the relevant line item and show the price and fit. If you cannot explain why the suggestion is there in a few words, remove it from the checkout path.
The Baymard Amazon observation is a warning about the cost of interrupting a task. It does not establish a revenue penalty for every upsell. Treat it as a reason to test whether the extra step blocks progress and whether the shopper can easily dismiss it.
Make the relevant product easy to recognize
When the offer is appropriate, put the facts the shopper needs next to it. A generic name and thumbnail will not tell someone if a replacement filter fits their selected machine. Include the distinguishing product name, price, selected compatibility and any available rating with its count. Let someone compare the offer while their cart stays visible.
In a separate Baymard desktop product-page benchmark, missing full titles were 40 percentage points more common than missing prices. That benchmark is not a census of cart offers. It provides a practical check when a recommendation is relevant but still takes too much work to evaluate.
Measure the whole order when testing an offer
Record how often eligible shoppers reach payment, complete an order and keep the recommended item. Separate the value of the add-on from the value of the original cart. A placement that sells more accessories can still reduce contribution if enough shoppers fail to complete the main order.
If the customer later asks about an abandoned cart, check what they were buying before bringing up extras. A compatible option can resolve a question about the order. An irrelevant promotion can send them back to the same decision that delayed payment.
Study data
| Measure | Value | Context |
|---|---|---|
| Irrelevant or other-customer-only cart cross-sells | 52% | Published source value |
| Measure | Value | Context |
|---|---|---|
| Extreme frustration at a standalone Amazon upsell | 66% | Published source value |
| Cross-sell gallery screenshots | 390 screenshots | Published source value |
| Desktop gallery screenshots | 205 screenshots | Published source value |
| Mobile gallery screenshots | 138 screenshots | Published source value |
| App gallery screenshots | 47 screenshots | Published source value |
| Measure | Value | Context |
|---|---|---|
| Desktop sites missing at least one important product detail | 68% | Published source value |
| Desktop sites missing fully visible titles | 55% | Published source value |
| Desktop sites missing prices | 15% | Published source value |
| Desktop sites missing average ratings | 50% | Published source value |
| Desktop sites missing variation information | 54% | Published source value |
| Desktop sites missing brand information | 7% | Published source value |
| Visually driven sites missing quality thumbnails | 8% | Published source value |
What changes when you compare the figures
| Comparison | Result | Calculation |
|---|---|---|
| Desktop cart sites outside the reported relevance problem | 48% | = 100-52 |
| Desktop product-page sites outside the reported essential-detail problem | 32% | = 100-68 |
| Missing title compared with missing price | 40 percentage points | = 55-15 |
| Missing rating compared with missing price | 35 percentage points | = 50-15 |
| Mobile or app share of gallery screenshots | 47.44% | = (138+47)/390*100 |
| Desktop screenshots compared with mobile and app screenshots | 20 screenshots | = 205-(138+47) |
Methodology and sources
Read Baymard’s cart relevance benchmark, its checkout example gallery and its separate desktop product-page detail benchmark. Compute complements of each reported binary share and compare rates within a matching benchmark group. The thumbnail subset and Amazon study are excluded from cross-attribute gap calculations.
Download the source data (CSV)
Download the calculations (CSV)
Download the citation notes (CSV)
Related reading
Checkout form field statistics for the fields shoppers actually have to consider
Cart abandonment statistics and the problems behind them
Checkout form error statistics and how shoppers recover
Return policy checkout statistics and what buyers need to see before paying
Sources and definitions
Baymard Institute: Cross-sell relevance in the cart
Baymard Institute: Checkout cross-sell examples
Baymard Institute: Product-page cross-sell information
The source data includes the population, period, denominator and limitations for every figure.