


Quick answer
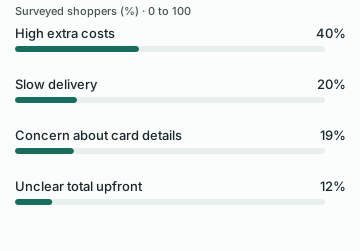
Baymard’s 2026 roundup places cart abandonment at 70.22%, the unweighted mean of 50 studies published between 2006 and 2025. Its separate US shopper survey found 42% cited browsing or unreadiness. Among the remaining reasons Baymard reports, 40% cited high extra costs and 20% slow delivery. Use the reason data to choose what to reproduce in your own checkout, and the compiled rate to understand how different published studies describe abandonment.
Baymard, Cart Abandonment Rate: 50 Statistics · Baymard Institute, Checkout UX 2026: 10 Pitfalls and Best Practices
Key findings and sources
How is the 70.22% cart abandonment rate calculated?
Baymard’s 2026 compilation reports a 70.22% unweighted mean across 50 cart-abandonment studies published from 2006 to 2025. Each study contributed one published percentage, regardless of its underlying cart count.
Baymard, Cart Abandonment Rate: 50 Statistics
How common is browsing among shoppers who abandon a cart?
In its 2026 cart-abandonment roundup, Baymard reports that 42% of surveyed US online shoppers cited browsing or unreadiness. Baymard sets this segment aside before presenting its list of the remaining reasons.
Baymard, Cart Abandonment Rate: 50 Statistics
How many fields does a US checkout typically show?
Baymard’s 2026 roundup reports a mean of 14.88 displayed form fields in its US checkout benchmark. Its separate usability example uses seven to eight fields. The difference compares form length and does not measure the sales effect of removing a field.
Baymard, Cart Abandonment Rate: 50 Statistics
How many audited mobile checkouts were rated mediocre or worse?
Baymard’s 2026 checkout UX benchmark rated 59% of evaluated mobile sites and 59% of evaluated desktop sites mediocre or worse. These are design ratings for leading US and European ecommerce checkouts, rather than shopper abandonment percentages.
Baymard Institute, Checkout UX 2026: 10 Pitfalls and Best Practices
How common is an unclear validation message?
Baymard’s 2026 checkout optimization guide reports that 98% of evaluated sites did not provide the recommended adaptive error messages. It documents a design gap and does not report the share of checkouts lost to it.
Baymard Institute, Optimize Your Ecommerce Checkout Flow
The 50-study abandonment compilation has a wide spread
Recomputing Baymard’s 50 published cart-abandonment rates for study years 2006–2025 gives a median of 71.20% and an interquartile interval from 63.19% to 75.60%, using medians of the two 25-row halves. The listed rates run from 55.00% to 84.27%. These are study-level summaries of a heterogeneous compilation.
Baymard, Cart Abandonment Rate: 50 Statistics
Same-year published cart rates can differ by more than twenty points
Baymard’s published table includes 2020 cart-abandonment rates of 84.27% from SaleCycle and 57.60% from Fresh Relevance. It also lists 2021 rates of 81.08% and 59.22% from those sources, respectively. The entries are separate studies with potentially different samples and definitions.
Baymard, Cart Abandonment Rate: 50 Statistics
High extra costs and an unclear upfront total are separate reported reasons
In Baymard’s published abandonment reasons after excluding the just-browsing segment, 40% cited high extra costs and 12% said they could not see or calculate the total upfront. The 28-point difference compares reported reasons and does not measure how much earlier disclosure would recover.
Baymard, Cart Abandonment Rate: 50 Statistics
Checkout elements outnumbered fields in the same Baymard benchmark
In Baymard’s US checkout benchmark, the reported means of 23.48 form elements and 14.88 form fields were 8.60 apart. That difference concerns the structure of audited checkouts and does not estimate time or purchases lost.
Baymard Institute, Checkout UX 2026: 10 Pitfalls and Best Practices
The headline changed less than one point when the entries were reweighted
Reweighting the 50 entries in Baymard’s 2026 cart-abandonment compilation gives 69.54% with equal weight for each of 20 printed source labels and 69.85% with equal weight for each of 19 represented study years. The entry-weighted mean is 70.22%.
Baymard, Cart Abandonment Rate: 50 Statistics
The unit is a published estimate from 2006 to 2025. These are unweighted group summaries of the compilation. Average within each exact printed label or study year, then average those group means equally.
Twenty-seven of the 50 published abandonment entries reached 70 percent
In Baymard’s 2026 compilation, 27 of 50 published cart-abandonment estimates from 2006 to 2025 were at or above 70%. The 54% figure is a share of estimates, with no weighting by underlying store or shopper count.
Baymard, Cart Abandonment Rate: 50 Statistics
Historical entries in one publisher compilation, rather than a pooled merchant sample. Count entries whose published rate meets the threshold, divide by 50.
Compare the results
What the 70.22% headline can tell you
Baymard’s headline gives each of 50 published studies one vote. A small study contributes as much to the arithmetic as a large study, and each study can define a cart, a completion window and a purchase differently. That makes 70.22% a useful description of published research and a poor replacement for your own checkout baseline. In the separate Baymard shopper survey, 42% cited browsing or not being ready. The 40% extra-cost figure comes from the list after Baymard sets that segment aside. Multiplying one by the other or applying both to your checkout traffic would introduce assumptions the source cannot verify.
In a merchant dashboard, count unique carts that reach a known state and choose a completion window before comparing rates. For example, if you have 1,000 carts, 400 checkout starts and 250 orders within 24 hours, cart abandonment is 75% and checkout-start abandonment is 37.5%, assuming orders belong to these carts and starts. Both can be right. When a campaign attracts exploratory shoppers, the first figure can rise while the second is unchanged. Compare the same event definitions by device and traffic source before assigning an engineering owner.
Count what shoppers are asked to do
Baymard reports a US benchmark mean of 14.88 fields and 23.48 elements. Its ideal-flow example uses seven to eight fields and 12 to 14 elements. The mean is 6.88 fields above the upper end of the example, and 9.48 elements above its upper end. Fields and elements are separate measures. A team can remove labels or help text and appear to reduce the element count while leaving exactly the same work for a buyer. Count visible fields, required entry and default visibility separately.
Pick a typical guest order and a case that needs an extra field, such as an apartment number or a separate billing address. Run both from a fresh phone session. A legitimate field should remain easy to find when the cart requires it. An avoidable field can become conditional or be deferred until after confirmation. Check error correction after each change because an apparently short address form can create extra work if a shopper has to guess why the first submission failed.
Separate a guest path from an account prompt
An account can be useful after checkout and an obstacle before it. Baymard’s public findings flag 56% of applicable sites for failing to defer account creation to confirmation and 47% for failing to make guest checkout the most prominent route. The study summaries do not report their overlap. Treat those figures as two different checks. A checkout might have a visible guest button and still interrupt shoppers with a password prompt halfway through.
Use a fresh browser with no account cookie, then repeat with a shopper email that is already registered. Some stores show a fast guest route until a recognized email prompts a sign-in. Record whether the shopper can proceed and whether the order preserves the original cart after entering a code or leaving the browser. If accounts are integral to a specific purchase, make that requirement clear before the shopper starts checkout and test an ordinary retail order separately.
Tell a valid form error from a broken checkout
The 2026 UX audit found 59% of desktop sites and 59% of mobile sites mediocre or worse. The equal headline does not establish equal symptoms. On one device, autofill may submit the wrong postal code. On another, the form may accept the address but fail to return shipping methods. Baymard’s benchmark also flags a lack of adaptive validation messages at 98% of applicable sites. A catch-all error message can make several different problems look the same in support tickets.
Recreate the issue with a valid address and then an intentionally invalid one. A good invalid case points the shopper to a specific correction. A valid case that fails should have its time, device, country and field recorded for investigation. If many buyers lose their details after submitting, fix form-state preservation before sending them back through the same route. A reminder is most useful after an available path has been confirmed.
Verify the first fix before changing the whole flow
Choose the repeated failure with the clearest reproducible evidence. Track the share of eligible checkouts that pass the repaired step, then check paid orders and completed orders in the same group. If a clearer error message increases successful corrections without changing overall completion, inspect what happens at the next step before calling it a revenue win. If recovery improves only on one device, report that result with the device and date range.
A useful starting comparison is guest versus signed-in, fresh versus resumed checkout and high versus low fulfillment cost. Keep those categories separate during the first read. A buyer who declines a visible fee, a buyer who never saw a guest button and a buyer whose form crashed may all appear as abandoned in the same report. Their first useful fixes belong to different teams.
Where a 71% abandonment rate sits in the published studies
The distribution behind Baymard’s 70.22% average is wide. Sorting all 50 displayed rates gives a median of 71.20%, with the middle half running from 63.19% to 75.60% using the medians of the two halves. The smallest displayed value is 55.00% and the largest is 84.27%. The interquartile span is 12.41 percentage points, and the full span is 29.27 points. This describes the listed studies. It does not tell you whether 71% is healthy for your own store.
The year label does not fix the comparability problem. For 2020, the table includes 84.27% from SaleCycle and 57.60% from Fresh Relevance. For 2021, the same two named sources show 81.08% and 59.22%. Differences of 26.67 and 21.86 points within the same labeled year are a concrete reason to compare definitions, merchant mix and observation windows before turning a published number into a target.
When you benchmark your own funnel, start with an event you can join to a paid order and compare like weeks with the same completion window. Separate shoppers who start checkout from people who add to cart without reaching it. If both populations are useful, show both. The broad published range is helpful when someone asks whether their figure is unusual. The decision to fix a particular step depends on where and why your own shoppers stop.
A price problem and a price visibility problem need different fixes
After excluding shoppers who said they were just browsing, Baymard listed high extra costs at 40% and inability to see or calculate the total upfront at 12%. The difference is 28 percentage points. The published share for high costs is about 3.33 times the unclear-total share. These are responses to different reasons. They cannot be added to estimate unique shoppers affected, and the difference does not establish how much abandonment an earlier total would recover.
Use the distinction when you investigate a real checkout. A buyer can see every line item and still decide shipping is too expensive. Another can accept the fee once the total is available but abandon when the amount is unclear before address entry. Record the subtotal, fee and final amount at each step for a few representative destinations. An early explanation of the total addresses the second case. A change in price or service is needed to address the first.
Apply the same separation to delivery speed and returns eligibility. Baymard reported 20% for slow delivery and 13% for an unsatisfactory returns policy, a seven-point difference. When buyers ask for help, identify which term is unclear before changing the checkout or promising a remedy.
Count the things a buyer has to understand, as well as fields they fill
Baymard’s US checkout benchmark reports a mean 23.48 form elements and 14.88 form fields. The difference is 8.60 elements per checkout on the reported averages. An element can be something the shopper reads or decides about rather than another typed input. That distinction helps explain why removing an optional field can leave the checkout feeling the same, while removing a decision a buyer cannot answer quickly can make the page easier to use.
Two reported reasons in Baymard’s abandonment survey illustrate how nearby problems are easily grouped together. Required account creation was cited by 18% and a long or complicated checkout by 17%, a one-point difference between the published responses. Those shares can overlap. Neither tells a team whether its most important issue is an account gate, an address prompt, or unclear delivery choices. The useful first task is to identify the decisions a new shopper has to resolve in order to submit a valid order.
Walk through checkout as a first-time mobile shopper, before any saved address or payment credentials are available. For each decision, note what the customer needs to know and whether that information is on the same screen. Re-run the path with a buyer returning to a stored address. The work that disappears for returning customers can reveal where first-time checkout is doing more of the explaining, and where the brand can move the decision closer to the product or cart.
What happens to the headline when every source gets one vote
The 70.22% average is often quoted as if it came from a single population of merchants. Baymard actually averages 50 published entries. Some source labels appear repeatedly, and some years contribute more observations than others. To see how much those choices move the headline, we took the mean within each exact source label and gave each of the 20 labels one vote. That produces 69.54%. Giving each of the 19 represented study years one vote produces 69.85%. The original entry-weighted result is 70.22%.
The benchmark is fairly stable across these weighting choices. Its usefulness for judging a single store is still limited by the spread of the underlying observations and by the way different publishers define carts. A publisher label can also change over time. For example, an entry printed as IBM and one printed as IBM / Coremetrics are counted as separate labels. This is a check on the table as published, with no claim that its labels identify independent datasets.
Use the benchmark to choose a comparison, then use your own cart cohorts to act
Twenty-seven of the 50 entries reached 70% or higher. For an operator, that places 70% near the middle of this historical compilation. It does not establish how many carts a new store can recover. Two months can show the same abandonment rate while having completely different amounts of payment failure, expensive delivery, or casual browsing.
Start the comparison when a cart is first created and give each cart the same window to become a paid order. Keep returning customers and guest users distinct if their identification quality differs. Within each cohort, check the share that reached a usable shipping quote and the share that reached a payment attempt. An audit finding belongs on the fix list when shoppers see it and drop off at the affected step. A store that changed how it creates or deduplicates carts needs to repair that denominator before comparing periods. Track assisted recovery separately so a late order is credited once.
A high total and a hidden total need different fixes
A shopper who sees a $9 shipping charge early may simply decide the order is too expensive. A shopper who learns about that same charge after entering an address may have formed a different expectation about the total. Both disappear from checkout. The first raises a pricing or fulfillment question. The second can often be investigated by moving a realistic estimate earlier in the journey.
Recreate the order using a representative postcode and the device where abandonment increased. Record the first point where the shopper can see the full payable total and whether any fee changes after that point. If shipping is genuinely address-dependent, a visible estimate and an explanation of when it becomes final are more useful than a blanket promise.
When a reminder sends the shopper back to the same problem
The survey assigns the same displayed 17% to a complicated checkout and to errors or crashes. The experience can look identical in an analytics funnel. Run the failing journey from a fresh session and capture the last action that succeeds. A form that loads and refuses a valid address needs a different fix from a checkout that times out.
A shopper who replies “the address won’t save” has already supplied better evidence than a general survey. Ask which step they were on, verify the route, and send a corrected path only when it actually works. Record the recurring issue for the team that owns checkout.
A useful weekly review starts with the base
Keep separate counts of carts created, checkout starts and shoppers who could receive a recovery message. Compare similar days and devices, using the same definition of a cart. A traffic campaign can bring in more browsers and raise the headline abandonment rate even while the checkout itself improves.
For the next review, choose one hypothesis and document what would rule it out. If unexpected fees appear to be the issue, first compare when the total is visible on high- and low-abandonment routes. If the total appears consistently, investigate fee size and available alternatives before changing the placement.
Study data
| Measure | Value | Context |
|---|---|---|
| Additional costs were too high | 40% | Includes shipping, taxes and fees |
| Delivery was too slow | 20% | A stated reason for abandonment |
| Concern about submitting card details | 19% | A stated trust concern |
| Account creation required | 18% | A stated reason for abandonment |
| Checkout was too long or complicated | 17% | Same displayed percentage as site errors |
| Site had errors or crashed | 17% | Distinct reason from a complicated form |
| Returns policy was unsatisfactory | 13% | A stated reason for abandonment |
| Total order cost was unclear upfront | 12% | Distinct from a total the buyer considers too high |
| Card declined | 10% | A stated reason for abandonment |
| Too few payment methods | 9% | A stated reason for abandonment |
| US shoppers citing browsing or unreadiness | 42% | Baymard sets this segment aside before publishing the other reasons. |
| Unweighted cart abandonment rate across published studies | 70.22% | Each study contributed one published rate. This is not a pooled rate for the underlying carts. |
| Mean default form elements in the US checkout benchmark | 23.48 elements | Counts the wider set of form elements, including more than just fields. |
| Mean default fields in the US checkout benchmark | 14.88 fields | Counts form fields only. |
| Upper end of the ideal form-element example | 14 elements | Baymard describes an ideal range of 12 to 14 elements. |
| Upper end of the ideal form-field example | 8 fields | Baymard describes seven to eight fields when fields are counted alone. |
| Median abandonment rate across the 50 compiled entries | 71.2% | Independent median of published rate rows; average of 71.00% and 71.39% |
| Lower quartile of abandonment rates across the compiled entries | 63.19% | Independent quartile using median of lower half |
| Upper quartile of abandonment rates across the compiled entries | 75.6% | Independent quartile using median of upper half |
| Lowest abandonment rate in the published compilation | 55% | Smallest displayed value |
| Highest abandonment rate in the published compilation | 84.27% | Largest displayed value |
| SaleCycle’s 2021 rate in the compilation | 81.08% | Displayed source and year |
| Fresh Relevance’s 2021 rate in the compilation | 59.22% | Displayed source and year |
| Fresh Relevance’s 2020 rate in the compilation | 57.6% | Displayed source and year |
| Measure | Value | Context |
|---|---|---|
| Desktop checkouts rated mediocre or worse | 59% | Leading US and European desktop sites. |
| Mobile site checkouts rated mediocre or worse | 59% | Mobile websites, separately rated. |
| App checkouts rated mediocre or worse | 60% | Mobile apps, separately rated. |
| Desktop checkouts rated good | 2% | Desktop sites in the audit. |
| Mobile site checkouts rated good | 1% | Mobile sites in the audit. |
| Desktop checkouts rated poor or very poor | 15% | Two lowest desktop ratings combined. |
| Benchmark sites that do not defer account creation to confirmation | 56% | Account creation guideline. |
| Benchmark sites that do not make guest checkout most prominent | 47% | Guest visibility guideline. |
| Benchmark sites that do not collapse completed accordion steps into summaries | 72% | Accordion checkout guideline. |
| Benchmark sites that label both required and optional fields explicitly | 14% | Field labeling guideline. |
| Benchmark sites that do not use applicable localized input masks | 64% | Formatting guidance for constrained inputs such as phone number. |
| Benchmark sites that do not use delivery dates as recommended | 41% | Calendar date versus shipping-speed language. |
| Benchmark sites that omit fulfillment options from the selector | 50% | Order-fulfillment selection guideline. |
| Measure | Value | Context |
|---|---|---|
| Benchmark sites that do not provide adaptive validation messages | 98% | Messages fail to tell shoppers what specifically went wrong and how to repair the input. |
| Measure | Value | Context |
|---|---|---|
| Publisher labels in the 50-row compilation | 20 publisher labels | Original count of exact printed labels |
| Study years represented in the 50-row compilation | 19 years | Original count of distinct study years |
What changes when you compare the figures
| Comparison | Result | Calculation |
|---|---|---|
| High costs versus slow delivery | 20 percentage points | = 40 − 20 |
| How often high costs were cited relative to slow delivery | 2 times | = 40 ÷ 20 |
| Average benchmark fields above the upper end of the usability example | 6.88 fields | = 14.88 minus 8 |
| Average benchmark elements above the upper end of the usability example | 9.48 elements | = 23.48 minus 14 |
| Share of the mean benchmark field count represented by the 8-field example | 53.76% | = 8 divided by 14.88, multiplied by 100 |
| Published compilation maximum minus minimum | 29.27 percentage points | = 84.27 - 55.00 |
| Distance between the upper and lower quartiles | 12.41 percentage points | = 75.60 - 63.19 |
| Difference between the two named 2020 entries | 26.67 percentage points | = 84.27 - 57.60 |
| Difference between the two named 2021 entries | 21.86 percentage points | = 81.08 - 59.22 |
| Extra costs cited minus unclear total cited | 28 percentage points | = 40 - 12 |
| Extra costs cited relative to unclear total | 3.33 times | = 40 / 12 |
| Slow delivery cited minus unsatisfactory return policy | 7 percentage points | = 20 - 13 |
| Mean benchmark form elements beyond typed or selected fields | 8.6 elements | = 23.48 - 14.88 |
| Required account creation versus long or complicated checkout | 1 percentage points | = 18 - 17 |
| Compilation mean with each printed source label given one vote | 69.5438% | = ((71.72) / 1 + (79.53 + 81.08 + 84.27 + 75.6 + 76.9 + 74.52 + 75.6 + 74.23) / 8 + (68.7 + 59.22 + 57.6 + 56.82) / 4 + (79.3) / 1 + (77.13 + 68.8 + 71.39 + 74) / 4 + (81.4 + 78) / 2 + (78 + 75 + 72 + 75 + 76) / 5 + (75.5) / 1 + (68.95 + 68.38) / 2 + (62.3) / 1 + (69.2) / 1 + (67.41 + 61.85 + 62.31 + 63.68 + 63.19 + 62.01 + 61.36) / 7 + (60.32) / 1 + (80.3) / 1 + (74.76 + 72.31 + 69.38) / 3 + (67) / 1 + (72 + 71 + 68) / 3 + (55 + 71) / 2 + (62.14) / 1 + (59.8) / 1) / 20 |
| Compilation mean with each represented study year given one vote | 69.8481% | = ((59.8) / 1 + (61.36) / 1 + (62.01) / 1 + (71 + 68 + 63.19 + 62.14) / 4 + (71 + 69.38 + 63.68 + 55) / 4 + (72.31 + 72 + 62.31) / 3 + (80.3 + 76 + 74.76 + 67 + 61.85) / 5 + (78 + 75 + 74.23 + 74 + 69.2 + 67.41 + 60.32) / 7 + (72 + 68.38 + 62.3) / 3 + (75.6 + 75 + 71.39 + 68.95) / 4 + (78 + 75.5 + 74.52 + 68.8) / 4 + (81.4 + 76.9) / 2 + (75.6 + 56.82) / 2 + (77.13) / 1 + (84.27 + 57.6) / 2 + (81.08 + 79.3 + 59.22) / 3 + (68.7) / 1 + (79.53) / 1 + (71.72) / 1) / 19 |
| Equal-entry mean minus the source-balanced mean | 0.6754 percentage points | = 70.2192 - 69.5438 |
| Equal-entry mean minus the year-balanced mean | 0.3711 percentage points | = 70.2192 - 69.8481 |
| Share of compilation entries at or above 70 percent | 54% | = 27 / 50 * 100 |
Methodology and sources
We transcribed Baymard’s current list and compared its rounded values within the same list. The 20 percentage-point gap is 40 minus 20. Baymard also reports a separate 70.22% unweighted average across 50 studies published from 2006 to 2025. That average describes different research and cannot serve as this survey’s denominator.
The figures come from Baymard’s shopper survey, published study compilation, checkout benchmark and usability guidance. The source records distinguish a respondent share, a share of audited sites, a mean count and a usability example. Guideline percentages are reported against their applicable benchmark groups; Baymard does not publish row-level sample counts for the selected guidelines. The arithmetic comparisons subtract the upper end of the stated ideal-flow examples from the benchmark means. Worked merchant dashboard examples are illustrative and do not add observations to the source data.
Equal-source weights treat exact printed labels as groups. Equal-year weights average across represented years. Neither calculation harmonizes source definitions, population sizes or observations.
Download the source data (CSV)
Download the calculations (CSV)
Related reading
Checkout form error statistics and how shoppers recover
Return policy checkout statistics and what buyers need to see before paying
Sources and definitions
Baymard Institute, Cart Abandonment Rate: 50 Statistics
Baymard Institute, Checkout UX 2026: 10 Pitfalls and Best Practices
Baymard Institute, Optimize Your Ecommerce Checkout Flow
The source data includes the population, period, denominator and limitations for every figure.