


Quick answer
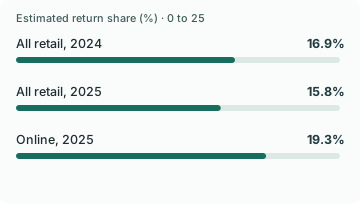
Baymard reported that 60% of its 1,032 survey respondents looked for return policy information on the product page, while 44% of audited sites did not display or link to it from the main product content. In a separate NRF and Happy Returns study, estimated returns were 19.3% of online sales value and 15.8% of all retail sales value in 2025.
Baymard Institute, The Current State of Ecommerce Product Page UX · Baymard Institute, Have Direct Links to Return Policy and Shipping Info in the Footer
Key findings and sources
Many respondents look for the return policy on the product page
In Baymard’s Consideration & Purchase Behavior survey, 60% of 1,032 respondents looked for return policy information on the product page. Separately, 44% of sites in its product-page benchmark did not display or link to it from the main product content.
Baymard Institute, The Current State of Ecommerce Product Page UX
The footer benchmark measures a separate route
Baymard reported that 20% of sites in its footer benchmark did not provide the direct return and shipping information link treatment. This criterion is separate from whether the main product content shows or links to the policy.
Baymard Institute, Have Direct Links to Return Policy and Shipping Info in the Footer
Estimated online return value exceeded the all-retail estimate
NRF and Happy Returns estimated that 19.3% of online sales value and 15.8% of all retail sales value would be returned in 2025. The 3.5-point difference compares published estimates with overlapping populations.
NRF and Happy Returns, 2025 Retail Returns Landscape
Free returns were a major consideration among people who had recently made an online return
In NRF and Happy Returns’ 2025 survey of 2,006 consumers who had returned an online purchase in the past year, 82% cited free returns as a major consideration, six points above the published 2024 comparison.
NRF and Happy Returns, 2025 Retail Returns Landscape
The reported poor-return experience measure increased four points
NRF and Happy Returns reported that 71% of consumers in the 2025 returns survey said a poor return experience made them less likely to shop with the retailer again, versus 67% in the published 2024 comparison. This measures reported intention.
NRF and Happy Returns, 2025 Retail Returns Landscape
US retail returned merchandise estimates fell by 40.1 billion dollars
NRF and Happy Returns reported $890 billion in returned retail merchandise in 2024 and estimated $849.9 billion for 2025, a difference of $40.1 billion, or about 4.5% of the 2024 figure. These are merchandise-value estimates across retail.
NRF and Happy Returns, 2025 Retail Returns Landscape
The free-return and repurchase margins imply a lower overlap bound
Using the rounded 82% free-return consideration and about 71% reduced repurchase-intent figures in NRF’s 2025 returns survey, at least about 53% would share both responses if those items use the same respondent base. The source does not publish the observed overlap.
NRF and Happy Returns, 2025 Retail Returns Landscape
2025 consumer survey of 2,006 people who had returned an online purchase in the past year. The bound assumes common effective denominators. Subtract 100 from the sum of the two reported shares to get the smallest mathematically possible overlap.
Two return policy placements had different benchmark coverage
Baymard’s public articles report 44% missing a product-page return-policy display or link and 20% lacking the direct footer-link treatment. The published margins differ by 24 points. The two checks address different locations and reveal no joint site-level count.
Baymard Institute, The Current State of Ecommerce Product Page UX · Baymard Institute, Have Direct Links to Return Policy and Shipping Info in the Footer
Baymard’s published site benchmarks for product-page and footer policy access. Subtract published omission shares and retain both site-check definitions.
Compare the results
The product page is where many buyers check the risk of ordering
Baymard found that 60% of its 1,032 survey respondents looked for return policy information on the product page. Its separate audit found that 44% of sites did not display or link to their policy from the main product content. The complement is 56% of audited sites. A shopper survey and a site audit do not share a denominator, so the difference between their percentages cannot tell you how many people could not find the policy.
A footer link is still useful for shoppers who expect to find policy details there. In a separate benchmark, Baymard found that 20% of sites omitted the direct footer link treatment for returns and shipping information. That is not the share missing links in both places. The two findings support checking both routes, since a footer link and an item-specific policy near the product serve different tasks.
Start with the condition that could change the purchase decision. If an item is final sale, the product page should make that condition easy to find. If a return is allowed but the shopper pays to ship it back, the answer should distinguish eligibility from cost. A broad “easy returns” claim gives the buyer less information than the applicable time window, condition and likely fee.
The return rate estimates answer a different business question
NRF and Happy Returns estimated that 19.3% of online sales value would be returned in 2025, compared with 15.8% of all retail sales value. The 3.5-point gap describes the published estimates. It is not the difference between online and store-only sales because the all-retail base includes online sales. Nor does it mean about one in five shoppers returned an order. The unit is sales value.
The consumer survey separately reported that 82% called free returns a major consideration, up six points from its published 2024 comparison. The survey included 2,006 consumers who had returned an online purchase within the previous 12 months. Their answers can help a merchant choose what to explain, but cannot establish the conversion gain from offering free returns to all buyers.
Track policy visibility and the financial terms separately. Showing the terms earlier is one intervention. Changing who pays for a return is another. Testing both at once makes it harder to distinguish a change in the buyer’s understanding from a change in the offer itself.
Check the path and measure what happens after the order
Open a normal product and a product with an exception, then look for each policy without relying on the site search. Check whether a customer can see the fee and deadline before paying, whether the linked policy applies to the exact item, and whether the support reply gives the same answer. Include a mobile visit where the buyer starts directly on a product page rather than the homepage.
For a store test, record how often buyers can find and explain the correct rule, checkout completion among assigned visits, and actual returns and net contribution once the observation window closes. A rise in completed orders can look good before returns mature. A clearer exception can also prevent a poor purchase without increasing immediate conversion. Both are reasons to track the downstream outcome alongside the immediate sale.
The research makes the policy worth examining. It does not decide whether a particular store should absorb all return fees. Test the disclosure with the actual item and terms first, then evaluate any fee or eligibility change on its own economics.
A returns-rate change and a change in returned dollars answer different questions
NRF and Happy Returns estimated $849.9 billion of merchandise returns for 2025, against $890 billion reported for 2024. The $40.1 billion difference is 4.5% of the earlier estimate. Separately, the reported all-retail return share moved from 16.9% to 15.8%. Those numbers are about estimated merchandise value. They say little about how many parcels a DTC team handled, how many units came back saleable, or what it cost to make refunds.
For a store, start the financial review with the value returned divided by eligible shipped merchandise value in the same matured order cohort. Then keep operational counts alongside it: orders that started a return, parcels received, refunds issued and items put back into inventory. A few costly items can raise the dollar ratio while the number of contacts falls. A policy comparison without those separate figures could push the brand to change a condition that has little to do with the workload.
When publishing or revising a policy, use the specific conditions shoppers ask about before ordering. Match eligibility, return shipping responsibility and refund timing to the product in their cart. Compare orders from before and after the change at the same age. An older cohort has had more time to start and complete a return, so comparing it with this week’s orders will make a policy change look more effective than the data can show.
Price and the experience after the parcel comes back both matter
Retail teams often ask whether shoppers mainly want free returns or a more dependable return experience. The NRF and Happy Returns survey supplies three separate margins for consumers with a recent online return. Eighty-two percent called free returns a major consideration, 76% were more likely to choose a route offering an instant refund or exchange, and about 71% said a bad experience makes them less likely to shop again. Those questions capture cost, speed of resolution, and willingness to return to the retailer.
If the three items share the same effective respondent base, the displayed percentages put a floor of 53% on the first and third answers overlapping. At least 58% could share the first and second answers under the same assumption. Across all three, the floor is about 29% and the ceiling is the smallest reported margin, about 71%. These are arithmetic limits, not observed joint response rates. The announcement identifies a 2,006-person consumer sample but publishes no respondent cross-tab or item-level denominators, and the reported margins are rounded.
Show the terms where the risk enters the purchase
Baymard’s product-page and footer benchmarks also look at different jobs. A shopper comparing two sizes needs the exchange window and applicable fee near the product. Someone with a delivered order often wants a durable footer route back to the full policy. The respective omission measures are 44% and 20%, a 24-point difference in the reported benchmark margins. That gap describes coverage of two different placements. It does not tell us whether a particular site had either or both.
For a merchant, the decision is to show the few terms that can change the purchase near the product or checkout, then carry the same terms into the full policy. At minimum, test one ordinary item, one sale or made-to-order item, and one destination with different handling. If a condition cannot be determined until the shopper picks a variant or enters a destination, show what information determines the answer and update it as soon as that information is available. Log how often the buyer sees the terms before submitting payment and reconcile any subsequent refund outcome on the same order.
Study data
| Measure | Value | Context |
|---|---|---|
| Product pages that do not display or link return policy from main content | 44% | Product pages that do not display or link return policy from main content |
| Shoppers who look for return policy information on the product page | 60% | Shoppers who look for return policy information on the product page |
| Shoppers who reported abandonment after an unsatisfactory returns policy | 15% | Shoppers who reported abandonment after an unsatisfactory returns policy |
| Measure | Value | Context |
|---|---|---|
| Ecommerce sites that lack the direct footer link treatment | 20% | Ecommerce sites that lack the direct footer link treatment |
| Measure | Value | Context |
|---|---|---|
| Consumers who cite free returns as a major consideration in 2025 | 82% | Consumers who cite free returns as a major consideration in 2025 |
| 2024 comparison for free returns as a major consideration | 76% | 2024 comparison for free returns as a major consideration |
| Consumers more likely to choose an instant refund or exchange route | 76% | Consumers more likely to choose an instant refund or exchange route |
| Consumers less likely to return to a retailer after a poor returns experience in 2025 | 71% | Consumers less likely to return to a retailer after a poor returns experience in 2025 |
| 2024 comparison for less likely to return after a poor experience | 67% | 2024 comparison for less likely to return after a poor experience |
| Estimated share of annual retail sales returned in 2025 | 15.8% | Estimated share of annual retail sales returned in 2025 |
| Estimated share of online sales returned in 2025 | 19.3% | Estimated share of online sales returned in 2025 |
| 2024 comparison for share of annual retail sales returned | 16.9% | 2024 comparison for share of annual retail sales returned |
| Consumers in the 2025 survey | 2,006 consumers | Consumers in the 2025 survey |
| Ecommerce professionals in the 2025 survey | 358 people | Ecommerce professionals in the 2025 survey |
| Merchants who prioritize updating the return process | 64% | Merchants who prioritize updating the return process |
| Measure | Value | Context |
|---|---|---|
| Estimated US retail merchandise returned in 2025 | 849.9 USD billions | Estimated US retail merchandise returned in 2025 |
| Reported US retail merchandise returned in 2024 | 890 USD billions | Reported US retail merchandise returned in 2024 |
What changes when you compare the figures
| Comparison | Result | Calculation |
|---|---|---|
| Product pages showing or linking policy as the complement of the missing criterion | 56% | = 100 - 44 |
| 2025 estimated online returns share minus all retail share | 3.5 percentage points | = 19.3 - 15.8 |
| 2025 online returns share relative to all retail share | 1.22 times | = 19.3 / 15.8 |
| 2025 minus 2024 stated importance of free returns | 6 percentage points | = 82 - 76 |
| 2025 minus 2024 stated reluctance to shop again after a bad return | 4 percentage points | = 71 - 67 |
| 2025 minus 2024 estimated all-retail returns share | -1.1 percentage points | = 15.8 - 16.9 |
| 2025 minus 2024 estimated returned merchandise value | -40.1 USD billions | = 849.9 - 890 |
| Relative change in the estimated returned merchandise value | -4.5056% | = (849.9 - 890) / 890 * 100 |
| Minimum overlap of free-return consideration and reduced repurchase intent | 53% | = 82 + 71 - 100 |
| Minimum overlap of free-return consideration and preference for an immediate outcome | 58% | = 82 + 76 - 100 |
| Minimum overlap of all three reported returns attitudes | 29% | = 82 + 76 + 71 - 200 |
| Product-page placement versus direct footer link omission | 24 percentage points | = 44 - 20 |
| Ratio of the two separately published placement omission shares | 2.2 times | = 44 / 20 |
Methodology and sources
We transcribed Baymard’s product-page recommendation and its separate footer benchmark, then transcribed the published NRF and Happy Returns survey announcement and its sample notes. We recalculated the complement of Baymard’s 44% missing treatment and descriptive differences within the NRF series. We do not compare the Baymard site share directly with the share of people who seek a policy, and we do not treat all retail and online as independent samples. Returned sales value, shopper intentions and audit criteria remain separate in the dataset.
Download the source data (CSV)
Download the calculations (CSV)
Related reading
Cart abandonment statistics and the problems behind them
Checkout form error statistics and how shoppers recover
Sources and definitions
Baymard Institute, The Current State of Ecommerce Product Page UX
Baymard Institute, Have Direct Links to Return Policy and Shipping Info in the Footer
NRF and Happy Returns, 2025 Retail Returns Landscape announcement
The source data includes the population, period, denominator and limitations for every figure.