


Quick answer
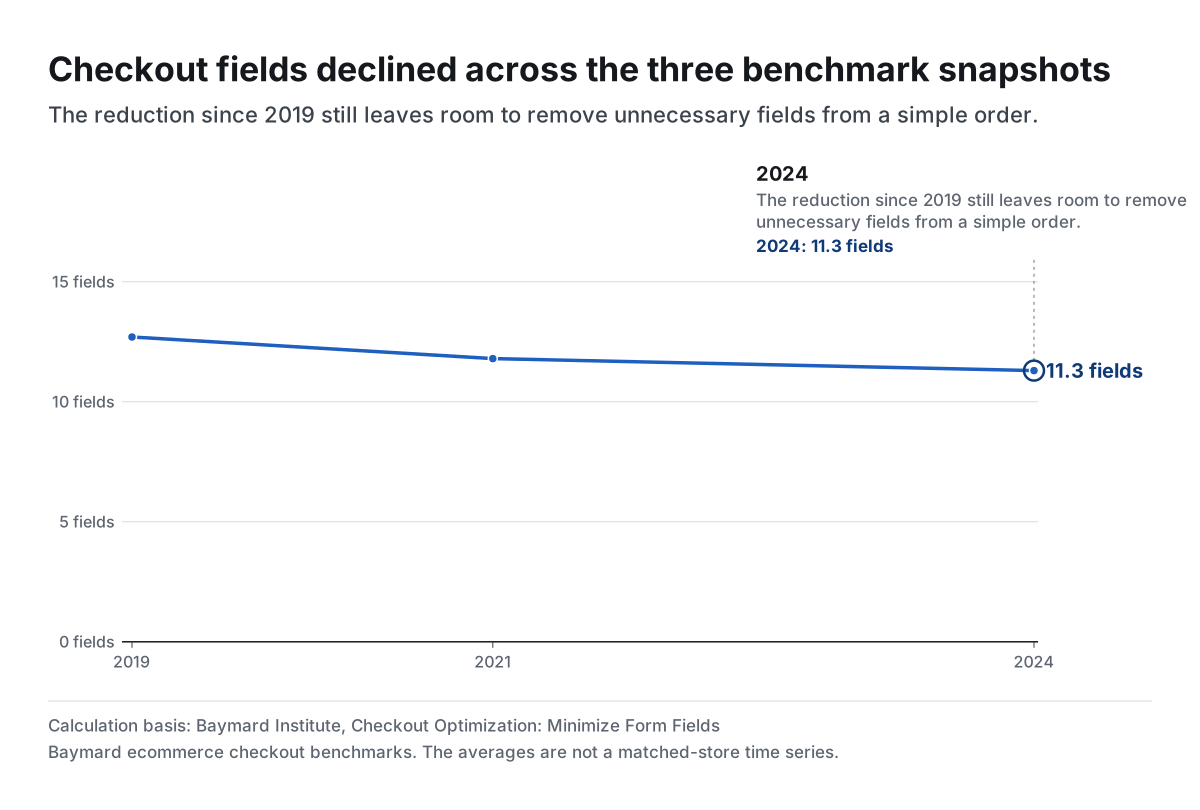
The average checkout in Baymard’s 2024 benchmark showed 11.3 fields, down from 12.7 in 2019. The reduction was 1.4 fields, or 11.02%, but the 2024 average was still 3.3 fields above the eight Baymard says most checkouts need.
Baymard Institute, Checkout Optimization: Minimize Form Fields
Key findings and sources
Checkout fields fell 11.02% across the reported snapshots
Basket Rescue calculates that average checkout form fields fell 11.02%, from 12.7 in Baymard’s 2019 benchmark to 11.3 in 2024.
Baymard Institute, Checkout Optimization: Minimize Form Fields
Baymard ecommerce checkout benchmark averages from 2019 and 2024. Subtract 11.3 from 12.7 and divide the difference by 12.7.
The 2024 average remained 3.3 fields above the reference
The 2024 average checkout showed 3.3 more fields than Baymard’s eight-field reference for a typical checkout, a 41.25% gap relative to that reference.
Baymard Institute, Checkout Optimization: Minimize Form Fields
A published checkout average compared with Baymard’s design reference. Subtract eight from 11.3 and divide by eight for the relative gap.
Average checkout length fell by another half-field after 2021
Baymard’s published average fell from 11.8 fields in 2021 to 11.3 in 2024, a difference of 0.5 fields.
Baymard Institute, Checkout Optimization: Minimize Form Fields
Baymard benchmark snapshots for 2021 and 2024. Subtract the 2024 benchmark average from the 2021 average.
Promo-code visibility is conditional on offering a code field
Baymard found a promotional-code field on 70% of sites in the cited benchmark, but its 35% default-visibility figure applies only to sites that had such a field.
Baymard Institute, Checkout Optimization: Minimize Form Fields
Site benchmark on promo-code field presence and display. Report each share on its original stated denominator.
Compare the results
Checkout fields declined across the three benchmark snapshots
The reduction since 2019 still leaves room to remove unnecessary fields from a simple order.
Field count tells you more than the step count
A three-step checkout can feel straightforward when each screen has one clear job. A single page can still ask the shopper to inspect an account prompt, a separate billing address and several fields they have no reason to complete. The benchmark tracks fields rather than assuming a one-page redesign makes checkout easier.
In 2024, Baymard reported 11.3 visible fields on average. That was down from 11.8 in 2021 and 12.7 in 2019. Progress matters, but the remaining 3.3-field gap is more than twice the 1.4 fields removed since 2019. Treat eight as a starting point for a simple order and account for the extra inputs your products or fulfillment actually require.
Keep uncommon tasks available without asking every shopper about them
Start with conditional inputs. If the shopper normally bills to their shipping address, let them confirm that assumption and show another address only when they need it. Keep the apartment or unit path discoverable without making everyone decide what to type into an unexplained second line.
The promo-code denominator is narrower. Baymard reported that 70% of benchmarked sites had a promotional-code field. Among sites with one, 35% showed it by default. Preserve a clear route for people who already have a code. The statistic is about what sites expose, not how many buyers leave to find a discount.
Count the inputs buyers see in a real order
Open the same checkout on a phone for a simple guest order, an apartment delivery and an order with a different billing address. Record how many fields the buyer can see before selecting those exceptions. Then compare the number of required fields, corrections and completed checkouts for comparable traffic.
On a recovered cart, return the shopper to their existing stage and retain information they already supplied. A field removed from the initial layout helps little if a returning shopper has to type their address again.
Study data
| Measure | Value | Context |
|---|---|---|
| 2019 average fields | 12.7 fields | Published source value |
| 2021 average fields | 11.8 fields | Published source value |
| 2024 average fields | 11.3 fields | Published source value |
| Typical necessary fields reference | 8 fields | Design reference rather than a mean |
| More than one name field | 89% | Published source value |
| Full name typed in First Name at least once | 42% | Published source value |
| Brief hesitation with a single full-name field | 4% | Published source value |
| Address Line 2 not initially hidden | 75% | Published source value |
| Paused when reaching Address Line 2 | 30% | Published source value |
| Sites with a promo field | 70% | Published source value |
| Promo field visible by default when offered | 35% | Published source value |
| Different billing address shown by default | 24% | Published source value |
What changes when you compare the figures
| Comparison | Result | Calculation |
|---|---|---|
| Fields removed between 2019 and 2024 | 1.4 fields | = 12.7 - 11.3 |
| Relative reduction between 2019 and 2024 | 11.02% | = (12.7 - 11.3) / 12.7 * 100 |
| 2024 average above the eight-field reference | 3.3 fields | = 11.3 - 8 |
| Relative field excess versus eight-field reference | 41.25% | = (11.3 - 8) / 8 * 100 |
| Fields removed between 2021 and 2024 | 0.5 fields | = 11.8 - 11.3 |
Methodology and sources
We transcribed the three published benchmark averages and the eight-field reference from Baymard's checkout form article. We recalculated changes using the earlier year or the eight-field reference as stated. The site percentages describe different benchmark items; promotional-code visibility is conditional on having a promotional-code field. Participant outcomes are separate usability observations. The time series compares benchmark snapshots, not a matched panel of retailers.
Download the source data (CSV)
Download the calculations (CSV)
Download the citation notes (CSV)
Related reading
Cart Cross-Sell Statistics on Relevance, Interruptions and Product Details
Cart abandonment statistics and the problems behind them
Checkout form error statistics and how shoppers recover
Return policy checkout statistics and what buyers need to see before paying
Sources and definitions
Baymard Institute, Checkout Optimization: Minimize Form Fields
The source data includes the population, period, denominator and limitations for every figure.