


Quick answer
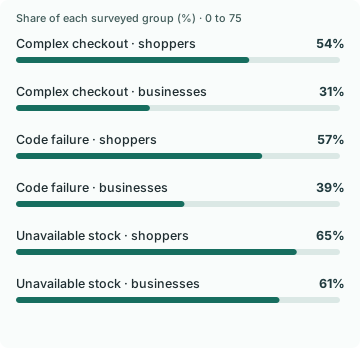
In DHL’s 2026 parallel surveys, 54% of shoppers said a complicated checkout had caused them to abandon an online purchase, while 31% of businesses said they could see that reason for abandoned carts. The 23-point difference was the largest of 13 published comparisons. Stock availability had a much smaller gap, 65% versus 61%. The groups were surveyed separately.
Key findings and sources
Checkout complexity had the largest reported visibility gap
Across the 13 reason pairs published by DHL in 2026, checkout complexity had the largest shopper-versus-business difference: 54% of shoppers recalled abandoning a purchase for that reason, compared with 31% of businesses saying they could see it in abandoned carts.
DHL, 2026 E-Commerce Trends Report
Eight of 13 reasons had a gap of at least 15 points
In Basket Rescue’s calculation from the 13 rounded shopper and business percentages in DHL’s 2026 report, eight reasons had a shopper-minus-business gap of at least 15 percentage points. The unweighted mean gap was 13.23 points.
DHL, 2026 E-Commerce Trends Report
Availability had a smaller gap than checkout complexity
In DHL’s separate 2026 shopper and merchant samples, stock unavailability was reported by 65% of shoppers and visible to 61% of businesses. Its four-point gap was 19 points smaller than the corresponding gap for checkout complexity.
DHL, 2026 E-Commerce Trends Report
Discount failures and unexpected charges both had 18-point gaps
In DHL’s 2026 comparison, 57% of surveyed shoppers reported abandoning after a discount-code failure versus 39% of businesses seeing that reason. Unexpected customs or tax charges showed a separate 63% versus 45% comparison.
DHL, 2026 E-Commerce Trends Report
Four directly testable checkout reasons averaged a 19-point response gap
In a Basket Rescue reconstruction of DHL’s 2026 global chart, unexpected customs or taxes, missing preferred payment, failed codes and checkout complexity averaged a 19.0-point shopper-to-business gap. The other nine displayed reasons averaged 10.7 points.
DHL, 2026 E-Commerce Trends Report
Global shopper and business samples in DHL’s 2026 survey, December 2025 to February 2026. The unit is a published reason pair. Subtract business from shopper shares for each reason; average each set of differences without weights.
Normalizing by the shopper response kept the complexity-stock contrast
Checkout complexity’s 23-point gap is 42.6% of its 54% shopper response share. Unavailable stock’s four-point gap is 6.2% of its 65% shopper response share. The normalized values compare published response margins.
DHL, 2026 E-Commerce Trends Report
Global DHL 2026 shopper and business responses, separate samples. Divide each reason’s shopper-minus-business point gap by its corresponding shopper share.
Compare the results
The clearest event can be easier to explain than the most frustrating step
Stock is a good comparison with checkout complexity. An unavailable variant can often produce an inventory result or a disabled purchase button. A complicated checkout can look exactly like a shopper who decided to think about it later: they stop clicking. In DHL’s table, the gaps for those two reasons were four and 23 percentage points respectively. The survey does not establish why the gap exists, but it gives teams a way to decide where instrumented events will tell a fuller story and where they need to hear from buyers.
The comparison also challenges the temptation to call every exit an offer problem. The largest gap in the table concerned checkout complexity. Two other large gaps concerned a code failing and unexpected customs or taxes, both 18 points. A larger incentive would address a different question in each case. One buyer needs a working code, another needs a credible total, and a third needs a simpler way to complete the current order.
Build the diagnosis around what the shopper was trying to do
For invalid codes, separate an expired code from an active code that cannot be used with the shopper’s cart. For duties, record whether the checkout could quote a landed total and whether the shopper reached the step where that total appeared. For complexity, review the path around the account choice, address form, and payment step on the same phone and with the same cart a customer would use. A generic checkout-exit event cannot distinguish those experiences.
Try a short open question for a sample of buyers who still have a legitimate reason to hear from the store. Capture the issue in the buyer’s own words before assigning it to a category. Read the answers alongside the events for the session and reserve an unknown category for cases that never replied. This stops the reasons given by people who answer from standing in for everyone who left.
Keep reason measurement separate from the recovery test
Once a reason is plausible, choose a fix that would change the outcome for that buyer. An explanation can help a person whose code is valid and applied automatically. A checkout fix is the right test when valid codes are actually rejected. For taxes, distinguish a confirmed amount from a cost the store cannot yet quote. The appropriate conversation depends on what the store can do now.
Measure resolution and completed orders separately. Someone can get a satisfactory explanation and still decide not to buy, or buy later without needing a message. Use the same denominator for the treated and comparison groups and check that both groups could actually complete the original purchase. DHL’s 13 comparisons are an idea generator for this measurement, rather than a forecast of how many orders the store will recover.
A checkout test can expose the biggest disagreement faster than a dashboard
DHL asked shoppers why they left a purchase and asked businesses about the reasons they see. To turn the 13 pairs into an investigation order, we grouped four reasons a checkout team can reproduce directly with a controlled cart. They are unexpected customs or taxes, a missing preferred payment method, a failed discount code, and checkout complexity. The average shopper-to-business gap was 19.0 percentage points for those four and 10.7 points for the remaining nine. This grouping is an editorial choice, and each reason gets the same weight.
Complexity also showed a 42.6% shortfall relative to its own shopper response share, compared with 6.2% for unavailable stock. The absolute and relative rankings agree for those two cases, so the choice of scale does not explain the difference. These are gaps between responses from separate populations. A larger gap can identify a useful place to investigate, but it cannot identify what share of actual abandonments a store could recover.
Match each complaint with an observable checkout event
Build test carts from the cases a real buyer encounters. For customs and taxes, enter the destination and check when the final charges become visible. For a preferred payment method, record the payment options available on the buyer’s device and in that market. For codes, distinguish a legitimate eligibility failure from a checkout error. For complexity, look for repeated address edits, backtracking, and an unresolved step after the buyer has attempted to proceed.
Start with a case your team can reproduce and then check whether a meaningful share of eligible carts encountered it. Give a high-priority fix one condition the team can measure before and after, such as valid promotions rejected per 100 eligible attempts. Include a buyer-feedback sample for reasons that leave weak event traces. If an item is unavailable before checkout starts, route it to inventory availability rather than counting it as a checkout-stage failure. This keeps the survey useful as an audit guide without assigning survey percentages to your own traffic.
Study data
| Measure | Value | Context |
|---|---|---|
| Shoppers: Delivery offering | 67% | Shoppers: Delivery offering |
| Businesses: Delivery offering | 52% | Businesses: Delivery offering |
| Shoppers: Stock unavailable | 65% | Shoppers: Stock unavailable |
| Businesses: Stock unavailable | 61% | Businesses: Stock unavailable |
| Shoppers: Unexpected customs or taxes | 63% | Shoppers: Unexpected customs or taxes |
| Businesses: Unexpected customs or taxes | 45% | Businesses: Unexpected customs or taxes |
| Shoppers: Preferred payment method unavailable | 62% | Shoppers: Preferred payment method unavailable |
| Businesses: Preferred payment method unavailable | 45% | Businesses: Preferred payment method unavailable |
| Shoppers: Returns offering | 58% | Shoppers: Returns offering |
| Businesses: Returns offering | 46% | Businesses: Returns offering |
| Shoppers: Discount code failed | 57% | Shoppers: Discount code failed |
| Businesses: Discount code failed | 39% | Businesses: Discount code failed |
| Shoppers: Product reviews or images missing | 54% | Shoppers: Product reviews or images missing |
| Businesses: Product reviews or images missing | 38% | Businesses: Product reviews or images missing |
| Shoppers: Checkout too complicated | 54% | Shoppers: Checkout too complicated |
| Businesses: Checkout too complicated | 31% | Businesses: Checkout too complicated |
| Shoppers: Site slow or complicated | 51% | Shoppers: Site slow or complicated |
| Businesses: Site slow or complicated | 36% | Businesses: Site slow or complicated |
| Shoppers: Security badges missing | 48% | Shoppers: Security badges missing |
| Businesses: Security badges missing | 31% | Businesses: Security badges missing |
| Shoppers: Guest checkout unavailable | 44% | Shoppers: Guest checkout unavailable |
| Businesses: Guest checkout unavailable | 37% | Businesses: Guest checkout unavailable |
| Shoppers: Chat or support unavailable | 39% | Shoppers: Chat or support unavailable |
| Businesses: Chat or support unavailable | 32% | Businesses: Chat or support unavailable |
| Shoppers: Sustainability credentials missing | 35% | Shoppers: Sustainability credentials missing |
| Businesses: Sustainability credentials missing | 32% | Businesses: Sustainability credentials missing |
What changes when you compare the figures
| Comparison | Result | Calculation |
|---|---|---|
| Checkout complexity response gap | 23 percentage points | = 54 - 31 |
| Unavailable stock response gap | 4 percentage points | = 65 - 61 |
| Difference between the complexity and stock gaps | 19 percentage points | = (54 - 31) - (65 - 61) |
| Mean response gap across the 13 reasons | 13.2308 percentage points | = (15 + 4 + 18 + 17 + 12 + 18 + 16 + 23 + 15 + 17 + 7 + 7 + 3) / 13 |
| Share of reasons with a gap of 15 points or more | 61.5385% | = 8 / 13 * 100 |
| Discount code failure response gap | 18 percentage points | = 57 - 39 |
| Unexpected customs or taxes response gap | 18 percentage points | = 63 - 45 |
| Mean gap among four reasons a merchant can inspect through a checkout test | 19 percentage points | = ((63 - 45) + (62 - 45) + (57 - 39) + (54 - 31)) / 4 |
| Mean gap across the other nine displayed reasons | 10.6667 percentage points | = ((67 - 52) + (65 - 61) + (58 - 46) + (54 - 38) + (51 - 36) + (48 - 31) + (44 - 37) + (39 - 32) + (35 - 32)) / 9 |
| Mean gap contrast between the selected four and the remaining nine | 8.3333 percentage points | = 19 - 96 / 9 |
| Relative response shortfall for checkout complexity | 42.5926 % of shopper response share | = (54 - 31) / 54 * 100 |
| Relative response shortfall for unavailable stock | 6.1538 % of shopper response share | = (65 - 61) / 65 * 100 |
Methodology and sources
We transcribed all 13 pairs on page 17 of DHL’s 2026 report. Subtract the business percentage from the shopper percentage for each row, then summarize the set without weighting reasons by prevalence. DHL surveyed 29,000 shoppers and 5,800 businesses across 29 and 28 markets, respectively. The two questions and respondents are separate. A gap does not estimate the proportion of merchants overlooking an individual shopper or the share of orders recoverable.
The testable group is defined for audit planning. The remaining reasons also matter. The group comparison weights reasons equally and provides no store-level abandonment estimate.
Download the source data (CSV)
Download the calculations (CSV)
Related reading
Cart abandonment statistics and the problems behind them
Checkout form error statistics and how shoppers recover
Return policy checkout statistics and what buyers need to see before paying
Sources and definitions
DHL, 2026 E-Commerce Trends Report
The source data includes the population, period, denominator and limitations for every figure.