


Quick answer
Baymard’s public cart benchmark reports that 50% of assessed sites made changing quantities difficult, versus 36% for removing items, a 14-point difference. In its separate order-review benchmark, 68% of assessed sites sent shoppers back to an earlier step to make an edit. Check whether an edit is saved and visible on the last screen before payment.
Baymard Institute, Cart design examples · Baymard Institute, Review Order design examples
Key findings and sources
Quantity updates were a more common cart problem than removals
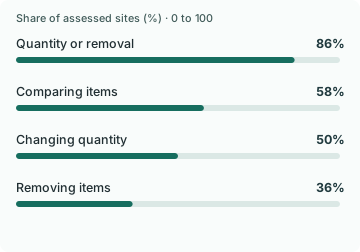
Baymard’s public cart benchmark reports that 50% of sites made quantity updates difficult, compared with 36% for item removal. The difference between the reported rates was 14 percentage points.
Baymard Institute, Cart design examples
Cart designs assessed by Baymard. Exact item bases are unpublished. Subtract the published item-removal share from the quantity-update share.
Cart friction also affected comparison
Baymard’s cart benchmark reports that 58% of assessed sites hindered using the cart for comparison, compared with 50% for difficulty updating quantities. The gap was eight percentage points across the published design measures.
Baymard Institute, Cart design examples
Two different design issues in the same public cart benchmark summary. No inference about overlap. Subtract published percentages, keeping the questions separate.
Review edits often meant going back in checkout
Baymard’s public order-review benchmark reports that 68% of assessed sites sent a shopper back to an earlier step when they wanted to edit information on the review screen.
Baymard Institute, Review Order design examples
Sites assessed for order-review editing. Exact item base is unpublished. Report the published share directly. It measures the interface path, not abandonment after an edit.
A quantity field can exist without supporting an easy edit
Baymard’s November 2026 checkout benchmark summary reports that 95% of assessed sites did not use buttons, alone or alongside an open text field, for updating cart quantity.
Baymard Institute, Checkout UX 2026: 10 Pitfalls and Best Practices
Sites assessed for quantity control design in Baymard’s 2026 checkout summary. The public article does not give the item base. Report the current summary’s implementation criterion directly. It differs from the gallery’s cart edit difficulty measure.
Compare the results
A shopper’s edit is only complete when the cart reflects it
Baymard’s cart benchmark puts difficulty changing the quantity at 50% and difficulty removing an item at 36%. Those are two ways a shopper can get stuck trying to buy the basket they actually want. In Baymard’s quantity-control testing, some people entered a new quantity, skipped a separate update action and reached order review with the original count still in place. The order would have looked right to someone remembering what they had typed.
Test the quantity shown, the line price, the subtotal and any delivery offer that depends on the basket. They should reflect the same confirmed edit. When an update is still running, show that state and give the shopper an unambiguous result. Use the same test for the cart drawer, cart page and order review, including a quick purchase path that skips the cart page. On a phone, try changing the quantity and tapping checkout immediately. That is where a field that waits for focus to move can silently drop the edit.
Keep the buyer close to the step they were trying to finish
Baymard’s order-review gallery reports that 68% of assessed sites sent shoppers to an earlier checkout step to edit information. That percentage describes a different question from the cart controls benchmark. It identifies a second place to test whether the buyer can still correct the order. Someone who notices the wrong count at the last moment should be able to make the correction and see the updated total without having to re-enter unrelated details.
There are cases where checkout really does have to recalculate. Reducing a bundle quantity can drop a discount, and changing an item can make a previous shipping choice unavailable. Keep the address and any still-valid choices, show what changed, then return the buyer to the review step. If a requested quantity exceeds stock, keep the confirmed quantity visible and offer the available amount. A shopper should be able to tell why the total or promised arrival changed.
Run the edit test before diagnosing every exit as price hesitation
Pick a product that comes in variants and another product sold in quantities greater than one. Add both, change the quantity, remove the second item, and then check the final review. Repeat after navigating back from payment. Include at least one route where an edit crosses a shipping or promotion threshold, because that is when stale subtotal information will mislead the buyer. Record both what the interface showed and what reached the final order. An edit that looks saved but disappears after a reload needs a different fix from a control the shopper never found.
If an edit is pending or rejected, a shopper asking for help needs the current contents and the available correction. If an item was removed deliberately and the cart is correct, leave it removed. When the original variant is now unavailable, explain the available alternative and give the shopper control over any substitution. A generic coupon will not repair a basket that differs from the order they intended to place.
Study data
| Measure | Value | Context |
|---|---|---|
| Cart quantity or removal was difficult | 86% | Cart quantity or removal was difficult |
| Cart quantity updates were difficult | 50% | Cart quantity updates were difficult |
| Cart item removal was difficult | 36% | Cart item removal was difficult |
| Cart design hindered product comparison | 58% | Cart design hindered product comparison |
| Cart gallery design examples | 1,249 design records | Cart gallery design examples |
| Desktop cart gallery examples | 612 design records | Desktop cart gallery examples |
| Mobile cart gallery examples | 562 design records | Mobile cart gallery examples |
| App cart gallery examples | 75 design records | App cart gallery examples |
| Measure | Value | Context |
|---|---|---|
| Order review edits sent shoppers to an earlier step | 68% | Order review edits sent shoppers to an earlier step |
| Measure | Value | Context |
|---|---|---|
| Checkout sites did not use recommended quantity controls | 95% | Checkout sites did not use recommended quantity controls |
| Accordion checkouts lacked completed-step summaries | 72% | Accordion checkouts lacked completed-step summaries |
| Checkout sites did not allow gift designation in cart | 68% | Checkout sites did not allow gift designation in cart |
| Measure | Value | Context |
|---|---|---|
| Checkout sites used a dropdown or text-only quantity control | 61% | Checkout sites used a dropdown or text-only quantity control |
What changes when you compare the figures
| Comparison | Result | Calculation |
|---|---|---|
| Quantity versus removal friction gap | 14 percentage points | = 50 - 36 |
| Quantity versus removal friction ratio | 1.39 times | = 50 / 36 |
| Comparison versus quantity benchmark gap | 8 percentage points | = 58 - 50 |
| Mobile-web share of cart design records | 45% | = 562 / 1249 * 100 |
| Share of cart designs for mobile web and apps combined | 51% | = (562 + 75) / 1249 * 100 |
| Mobile web cart examples versus desktop example count | 50 design records | = 612 - 562 |
Methodology and sources
We transcribed the public percentages on Baymard’s Cart and Order Review galleries and read its 2026 checkout summary and 2022 quantity-control study for design context. We subtract or divide comparable percentage measures in the cart gallery and calculate the mix of its design records separately. The gallery has 1,249 annotated screenshots and can include more than one per site. It is not the denominator of the benchmark percentages, whose item bases are not published. Older findings and the 2026 selector benchmark use different or undisclosed samples. These results measure design patterns, not the impact of changing one.
Download the source data (CSV)
Download the calculations (CSV)
Related reading
Cart abandonment statistics and the problems behind them
Checkout form error statistics and how shoppers recover
Return policy checkout statistics and what buyers need to see before paying
Sources and definitions
Baymard Institute, Cart design examples
Baymard Institute, Review Order design examples
Baymard Institute, Checkout UX 2026: 10 Pitfalls and Best Practices
Baymard Institute, Use Buttons or Buttons Plus an Open Text Field for Updating Cart Quantity
The source data includes the population, period, denominator and limitations for every figure.